

Last updated: 9 October 2026
By Mubasshera Usmani
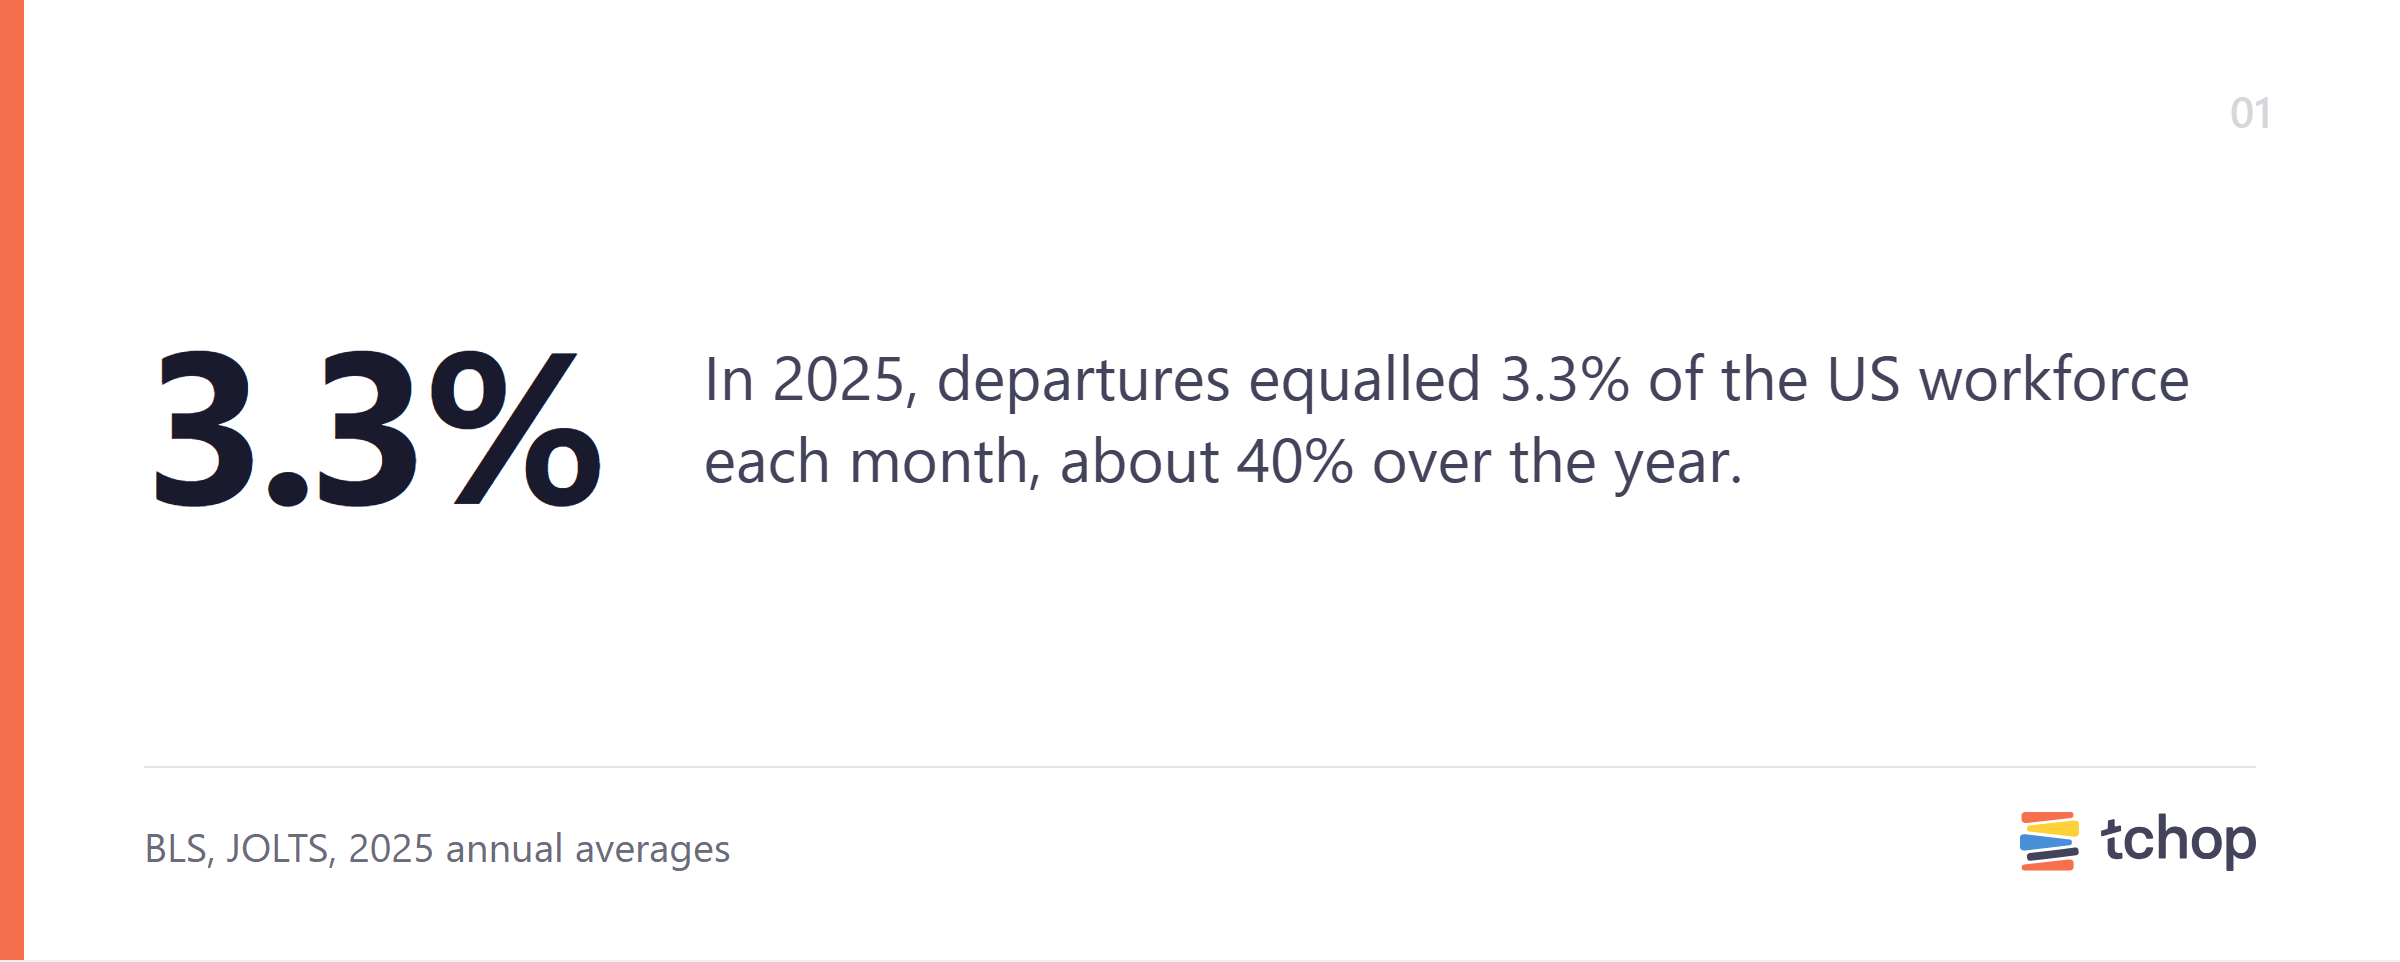
In 2025, departures from US jobs equalled 3.3% of the workforce every month, according to the Bureau of Labor Statistics (BLS). Over a full year, that adds up to about 40%. Among individual industries, arts, entertainment, and recreation (6.1% a month) and accommodation and food services (5.5%) had the highest turnover. Government and finance had the lowest.
This guide sets out the average turnover rate by industry, using the latest official annual figures from the BLS Job Openings and Labor Turnover Survey (JOLTS), released on 13 March 2026. It also shows you how to calculate and compare your own rate, and takes a closer look at the frontline industries, where many employees don’t work at a desk.
At a glance
Key numbers
- 3.3% a month: the national average turnover rate in 2025, unchanged from 2024 and about 40% over the year
- 2.0% a month quit voluntarily, down from 2.1% in 2024
- 1.1% a month were laid off or discharged, unchanged from 2024
- 6.1% a month in arts, entertainment, and recreation, the highest of any individual industry
- 1.4% a month in state and local government, the lowest
Source: BLS, Job Openings and Labor Turnover Survey, 2025 annual averages (monthly rates), sample of about 21,000 US business and government establishments
What is employee turnover rate?
Employee turnover rate is the share of employees who leave an organisation over a set period. The BLS measures it as total separations: every departure from the payroll, for any reason, as a percentage of total employment.
Total separations are made up of three types:
Quits: employees who leave voluntarily, not counting retirements or transfers. The BLS notes that the quits rate “can serve as a measure of workers’ willingness or ability to leave jobs.”
Layoffs and discharges: departures initiated by the employer. These include layoffs, dismissals, and the end of seasonal or short-term jobs.
Other separations: retirements, transfers to other locations, disability, and deaths.
When articles and benchmarks talk about “turnover”, they usually mean total separations, because it captures every departure, whatever the reason. That is the measure used in this guide. In 2025, quits accounted for 60.6% of all separations in the US, layoffs and discharges for 33.8%, and other separations for 5.6% (BLS).
Where the data comes from. JOLTS is based on a monthly sample of about 21,000 business and government establishments across the US. It covers all nonfarm employers, both private and public. Because it counts departures rather than people, one person who leaves two jobs in a year counts twice. So, a 40% annual rate doesn’t mean that 40% of all workers changed jobs. It means departures added up to 40% of the average workforce.
How to calculate your average turnover rate
The basic formula is:
Turnover rate = employees who left during the period ÷ average number of employees in the period × 100
To find your voluntary turnover rate, count only the employees who resigned. To find your involuntary rate, count only those you let go.
A worked example. A company employs 400 people on average over the year, and 140 leave during that time. Of those, 90 resign and 50 are let go.
Annual turnover rate: 140 ÷ 400 × 100 = 35%
Voluntary turnover rate: 90 ÷ 400 × 100 = 22.5%
Involuntary turnover rate: 50 ÷ 400 × 100 = 12.5%
Monthly vs annual rates. This is where most comparisons go wrong. The BLS publishes its “annual average” rates as the rate for a typical month. An annual rate is roughly the sum of the 12 monthly rates, so you can multiply a monthly average by 12 to compare it with a yearly figure. The national rate of 3.3% a month, for example, is about 40% a year.
Before comparing your own number with the figures below, make sure both are monthly or both are annual.
Average turnover rate by industry (2025 BLS data)
All rates in the table are monthly: the BLS annual average for 2025, which shows the share of employees leaving in a typical month. To compare a figure with your own annual turnover rate, multiply it by 12.
Data
Average turnover rate by industry (2025 BLS data)
| Industry | Total separations, monthly (2025) | Quits, monthly (2025) | Layoffs and discharges, monthly (2025) | Change in total separations vs 2024 |
|---|---|---|---|---|
| All industries | 3.3% | 2.0% | 1.1% | No change |
| Total private | 3.6% | 2.2% | 1.2% | −0.1 pts |
| Mining and logging | 3.3% | 2.1% | 1.1% | No change |
| Construction | 4.0% | 1.8% | 2.1% | No change |
| Manufacturing | 2.4% | 1.4% | 0.9% | −0.3 pts |
| Durable goods | 2.3% | 1.3% | 0.8% | −0.2 pts |
| Nondurable goods | 2.7% | 1.6% | 1.0% | −0.4 pts |
| Trade, transportation, and utilities | 3.5% | 2.2% | 1.1% | −0.1 pts |
| Wholesale trade | 2.3% | 1.4% | 0.8% | −0.1 pts |
| Retail trade | 3.8% | 2.6% | 1.1% | −0.2 pts |
| Transportation, warehousing, and utilities | 4.0% | 2.2% | 1.6% | +0.1 pts |
| Information | 2.8% | 1.3% | 1.3% | No change |
| Financial activities | 2.3% | 1.4% | 0.6% | +0.1 pts |
| Finance and insurance | 2.1% | 1.3% | 0.6% | +0.2 pts |
| Real estate and rental and leasing | 2.6% | 1.6% | 0.9% | −0.3 pts |
| Professional and business services | 4.6% | 2.3% | 2.0% | +0.2 pts |
| Private education and health services | 2.8% | 1.9% | 0.7% | −0.1 pts |
| Private educational services | 2.2% | 1.4% | 0.7% | No change |
| Health care and social assistance | 2.9% | 2.0% | 0.7% | −0.1 pts |
| Leisure and hospitality | 5.6% | 3.9% | 1.5% | +0.1 pts |
| Arts, entertainment, and recreation | 6.1% | 2.2% | 3.8% | No change |
| Accommodation and food services | 5.5% | 4.2% | 1.1% | +0.1 pts |
| Other services | 3.3% | 2.2% | 1.0% | −0.3 pts |
| Government | 1.5% | 0.8% | 0.4% | +0.1 pts |
| Federal | 1.8% | 0.8% | 0.3% | +0.7 pts |
| State and local | 1.4% | 0.8% | 0.4% | −0.1 pts |
| State and local education | 1.4% | 0.8% | 0.3% | No change |
| State and local, excluding education | 1.5% | 0.8% | 0.4% | No change |
Source: BLS JOLTS, tables 20, 22, and 24, annual averages, not seasonally adjusted, published 13 March 2026. US data, sample of about 21,000 establishments. All rates are monthly averages. “pts” means percentage points. Quits and layoffs don’t add up to total separations, because other separations (retirements, transfers, disability, and deaths) aren’t shown.
What the table shows:
Hospitality and recreation lead by a wide margin. Arts, entertainment, and recreation (6.1%) and accommodation and food services (5.5%) have the highest turnover of any individual industry. But the reasons differ. In hotels and restaurants, most people leave by choice. In arts and recreation, layoffs and discharges (3.8%) are higher than quits (2.2%). The BLS counts the end of seasonal jobs as layoffs.
Professional and business services comes next. At 4.6% a month, its turnover is higher than retail’s. The sector includes staffing agencies, and the BLS counts agency workers under the agency that employs them, not the client they work for.
Government and finance keep people longest. State and local government (1.4%) has the lowest rate overall. In the private sector, finance and insurance (2.1%) is lowest. The one notable riser was the federal government, where separations went up from 1.1% to 1.8% a month, the largest increase of any sector in 2025.
Turnover in frontline industries
In frontline industries, people work in shifts, on the move, or on the shop floor, often without a desk or a company email address. Several of them are among the industries with the highest turnover in the US.
Accommodation and food services: 5.5% a month
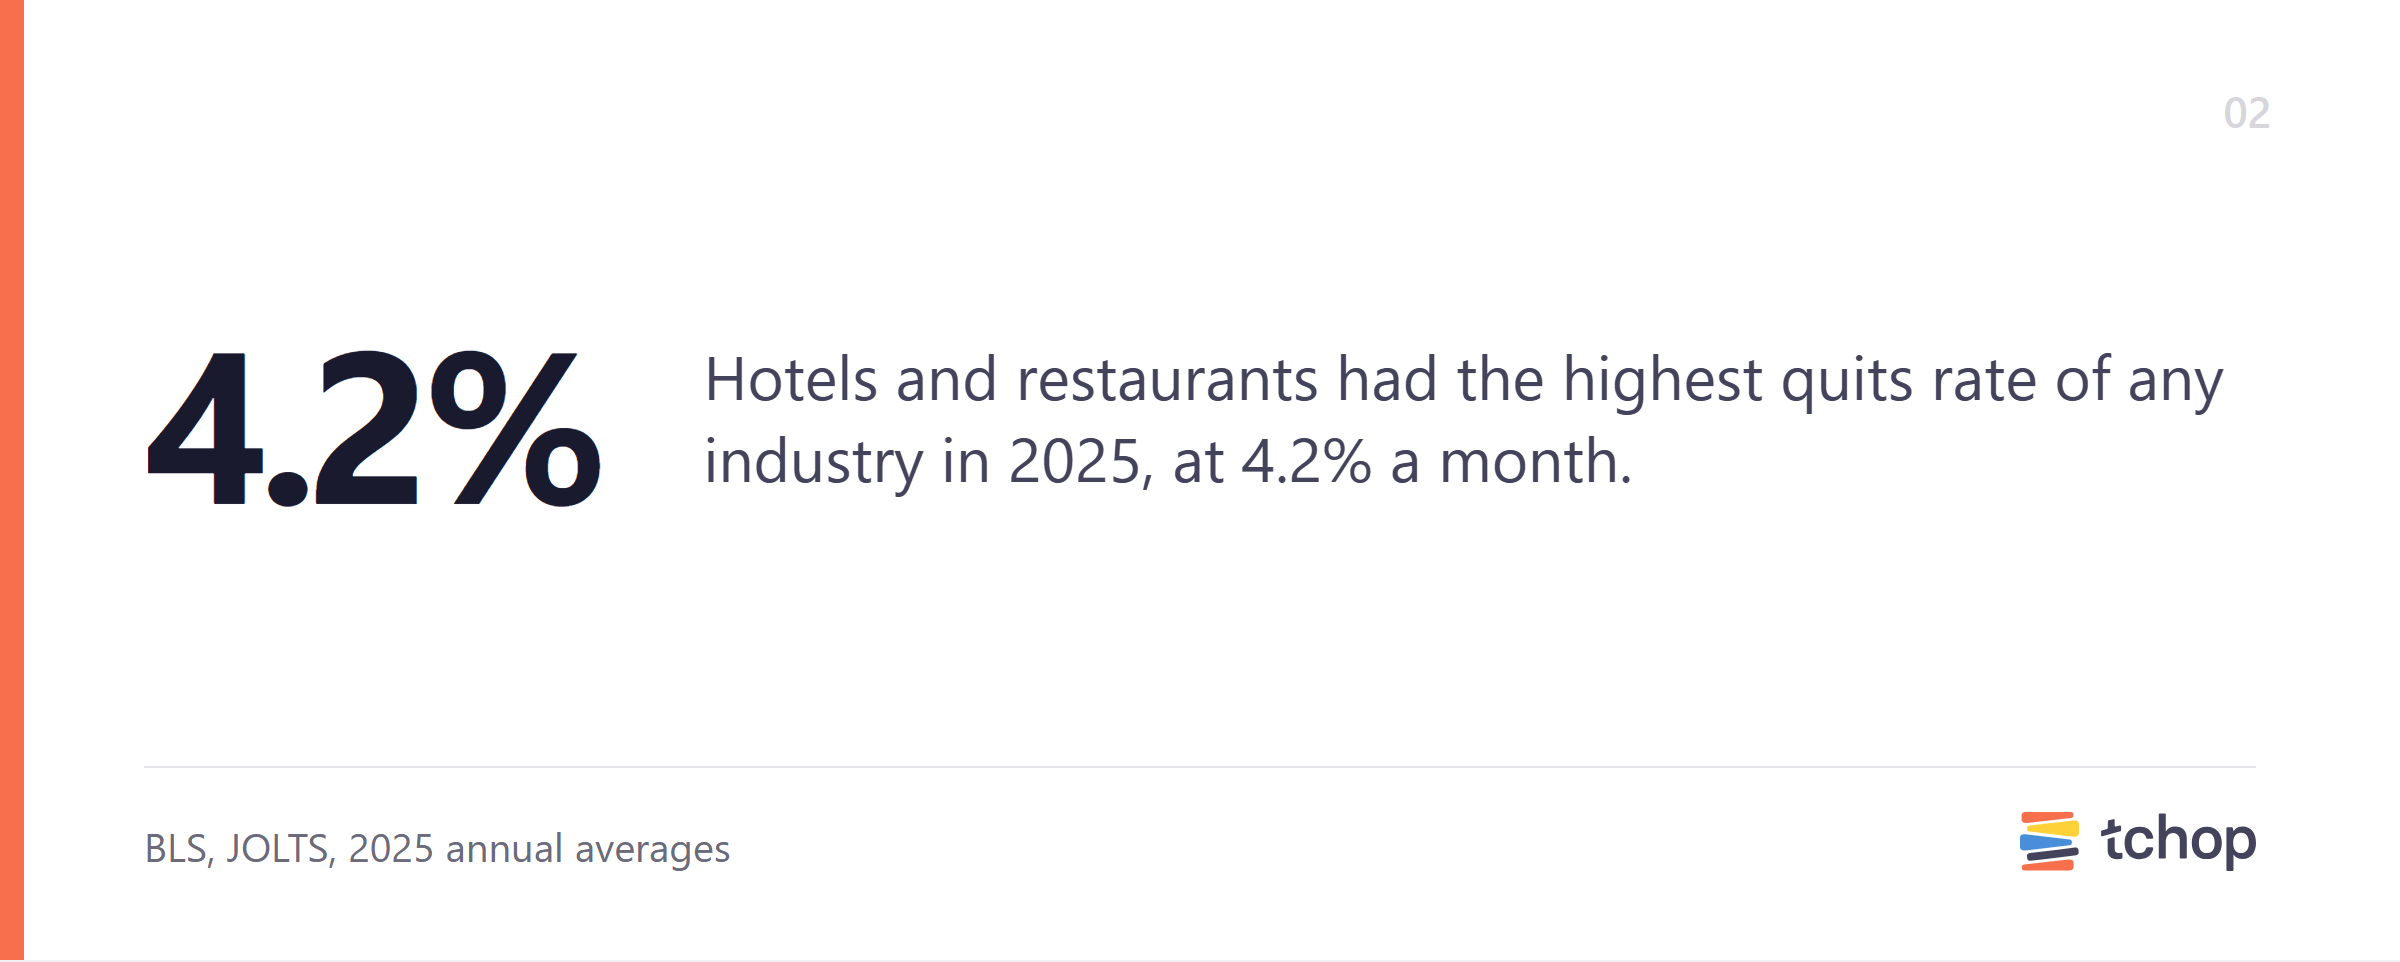
Hotels and restaurants had a total separations rate of 5.5% a month in 2025, about 66% a year, up slightly from 5.4% in 2024. They also have the highest quits rate of any industry, at 4.2% a month, compared with layoffs and discharges of 1.1%. In other words, most people who leave this sector choose to.
Retail trade: 3.8% a month
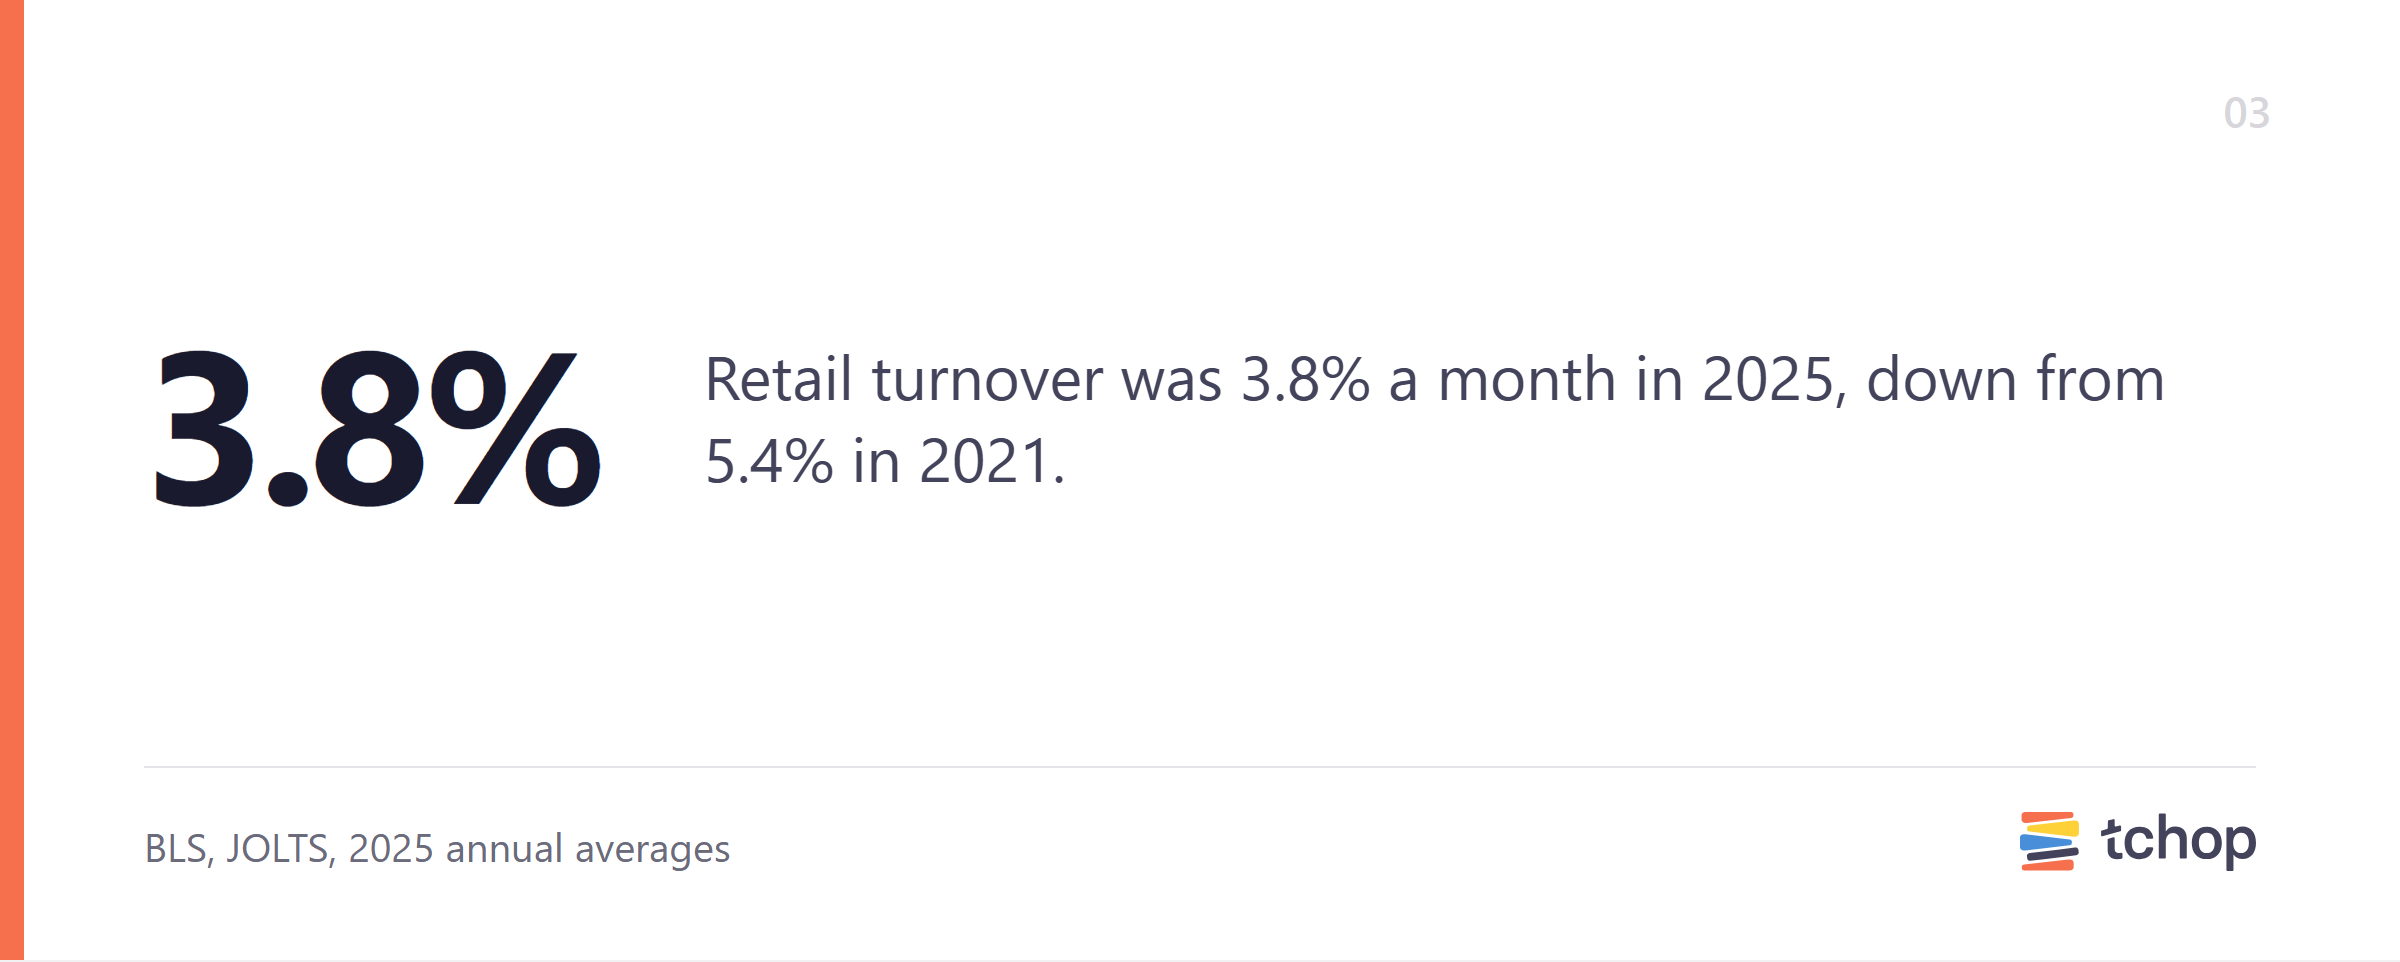
The retail employee turnover rate was 3.8% a month in 2025, about 46% a year, down from 4.0% in 2024. Quits made up most of it, at 2.6%, with layoffs and discharges at 1.1%.
The average turnover rate in retail has fallen every year since 2021, when it was 5.4% a month. Even so, it remains above the national average.
Transportation, warehousing, and utilities: 4.0% a month
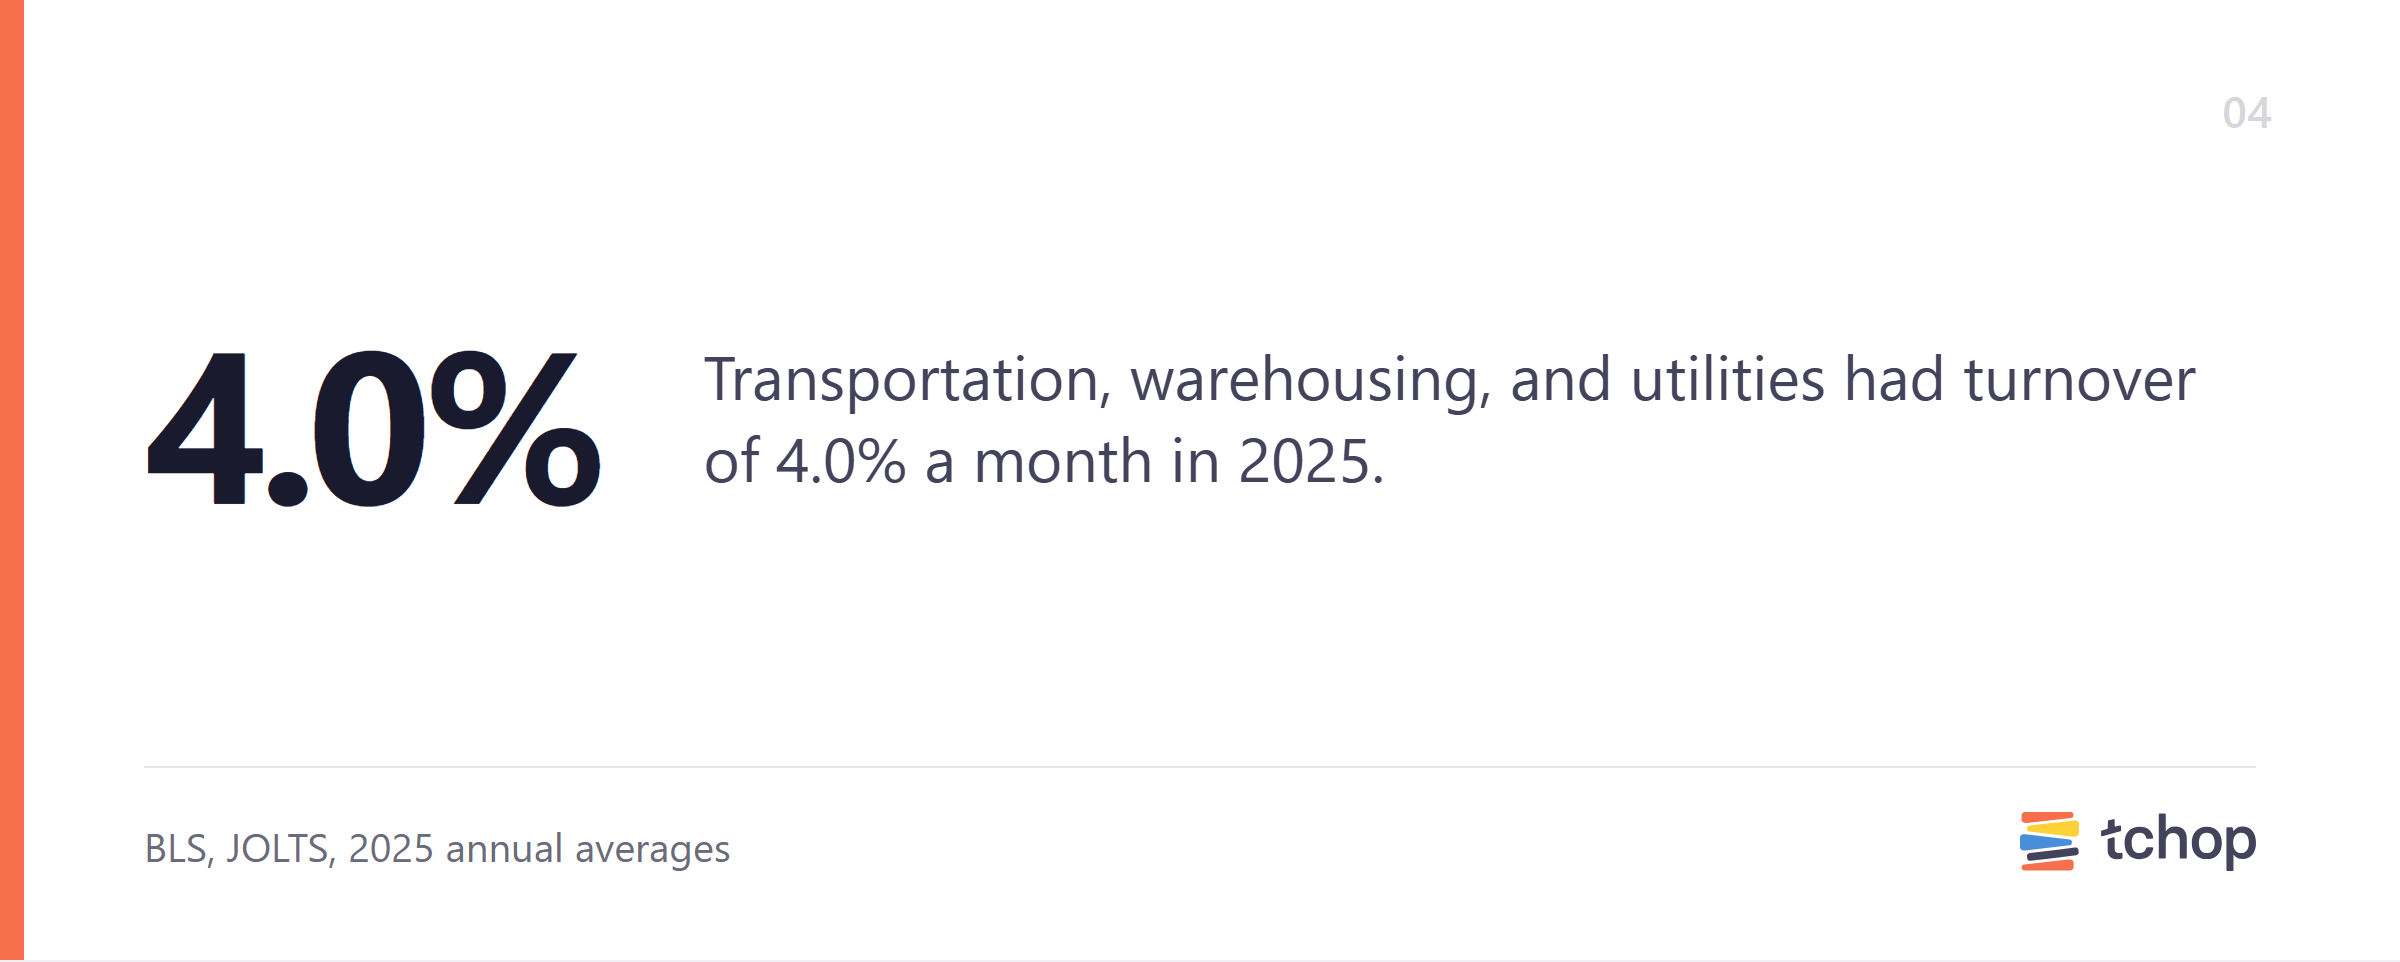
The BLS groups transportation, warehousing, and utilities together, so there is no official warehouse turnover rate on its own. For the group as a whole, turnover was 4.0% a month in 2025, about 48% a year, up slightly from 3.9% in 2024. Layoffs and discharges were relatively high, at 1.6% a month, alongside quits of 2.2%.
Health care and social assistance: 2.9% a month
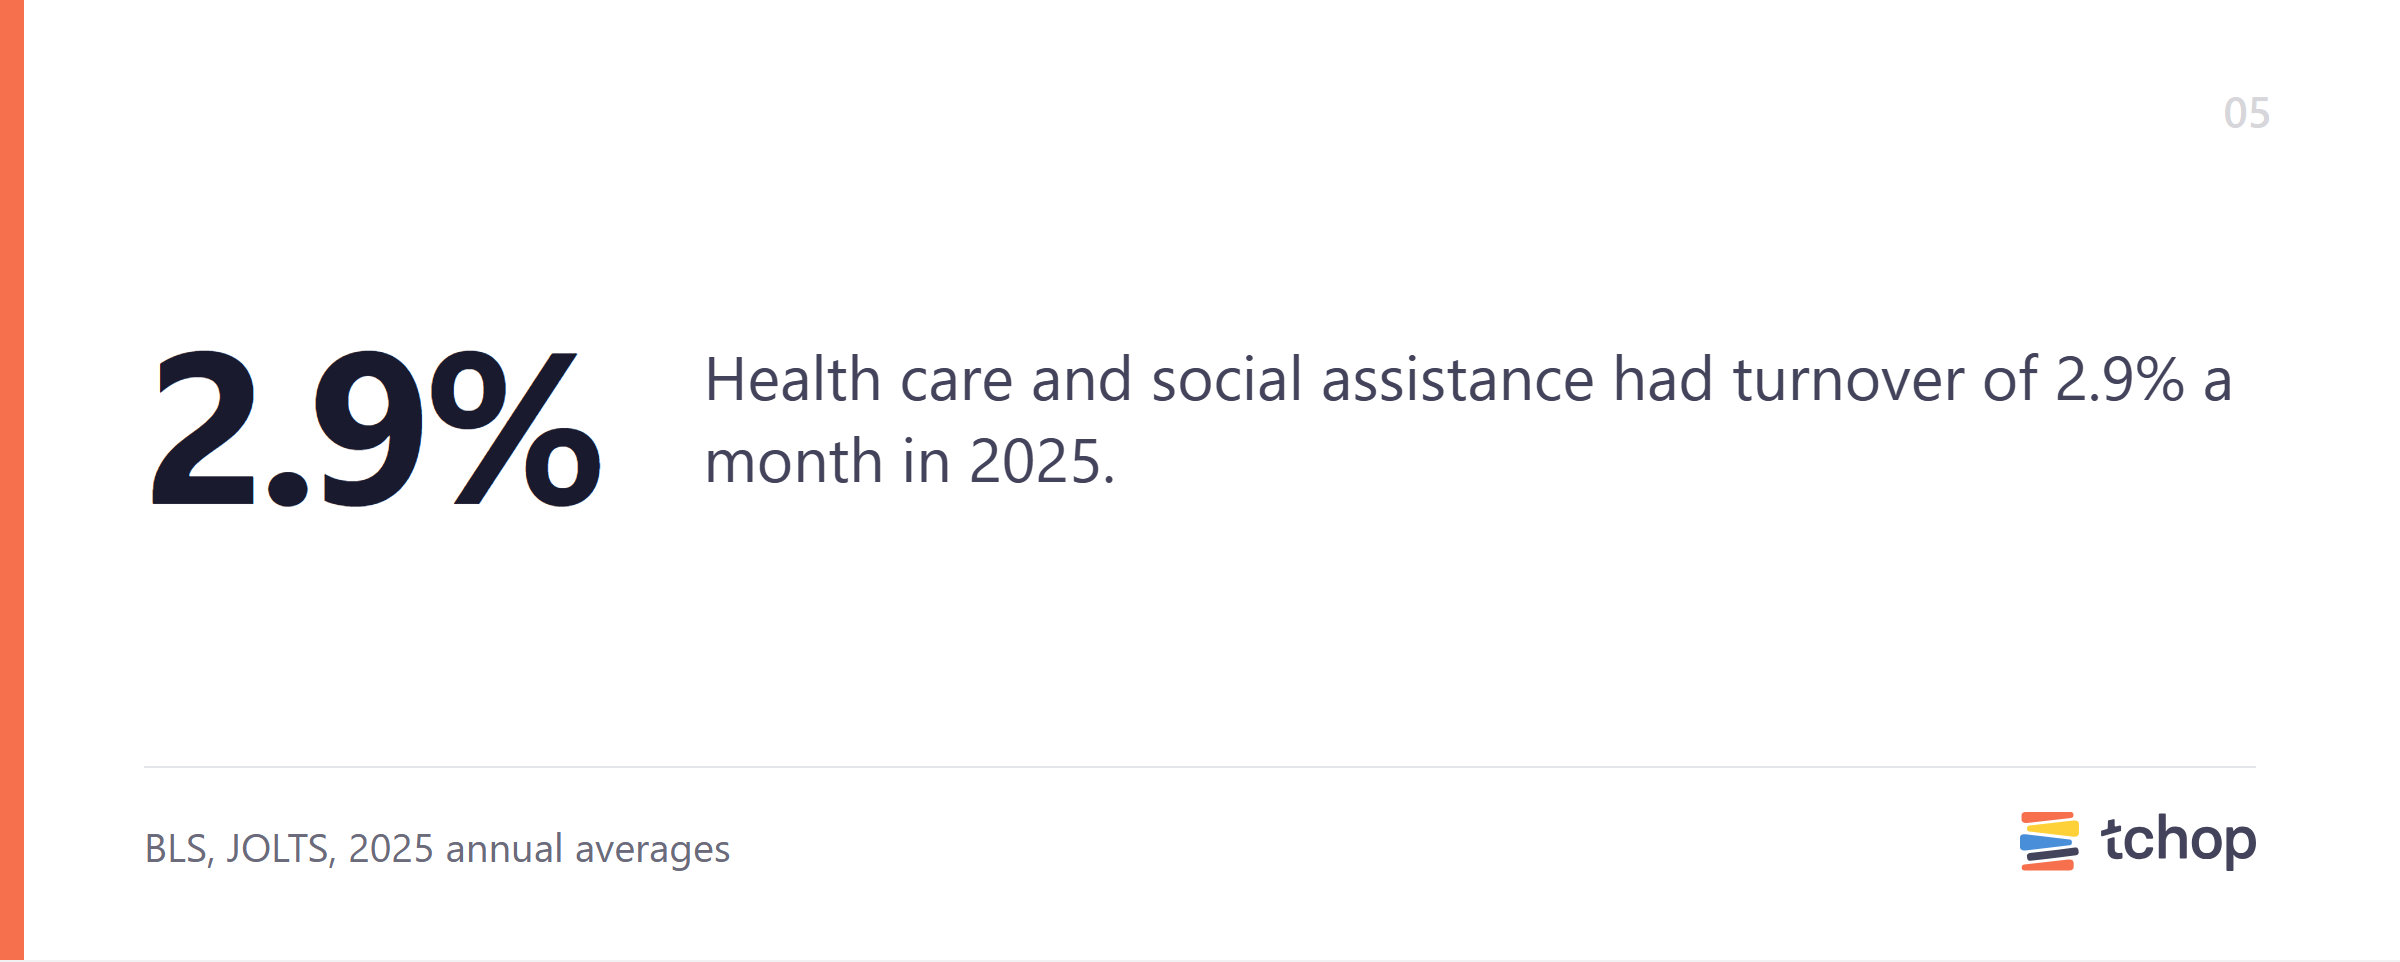
The healthcare turnover rate, which the BLS reports as health care and social assistance, was 2.9% a month in 2025, about 35% a year, down from 3.0% in 2024. Layoffs and discharges were among the lowest of any industry, at 0.7%, so most turnover in this sector comes from people choosing to leave (quits: 2.0%).
Manufacturing: 2.4% a month
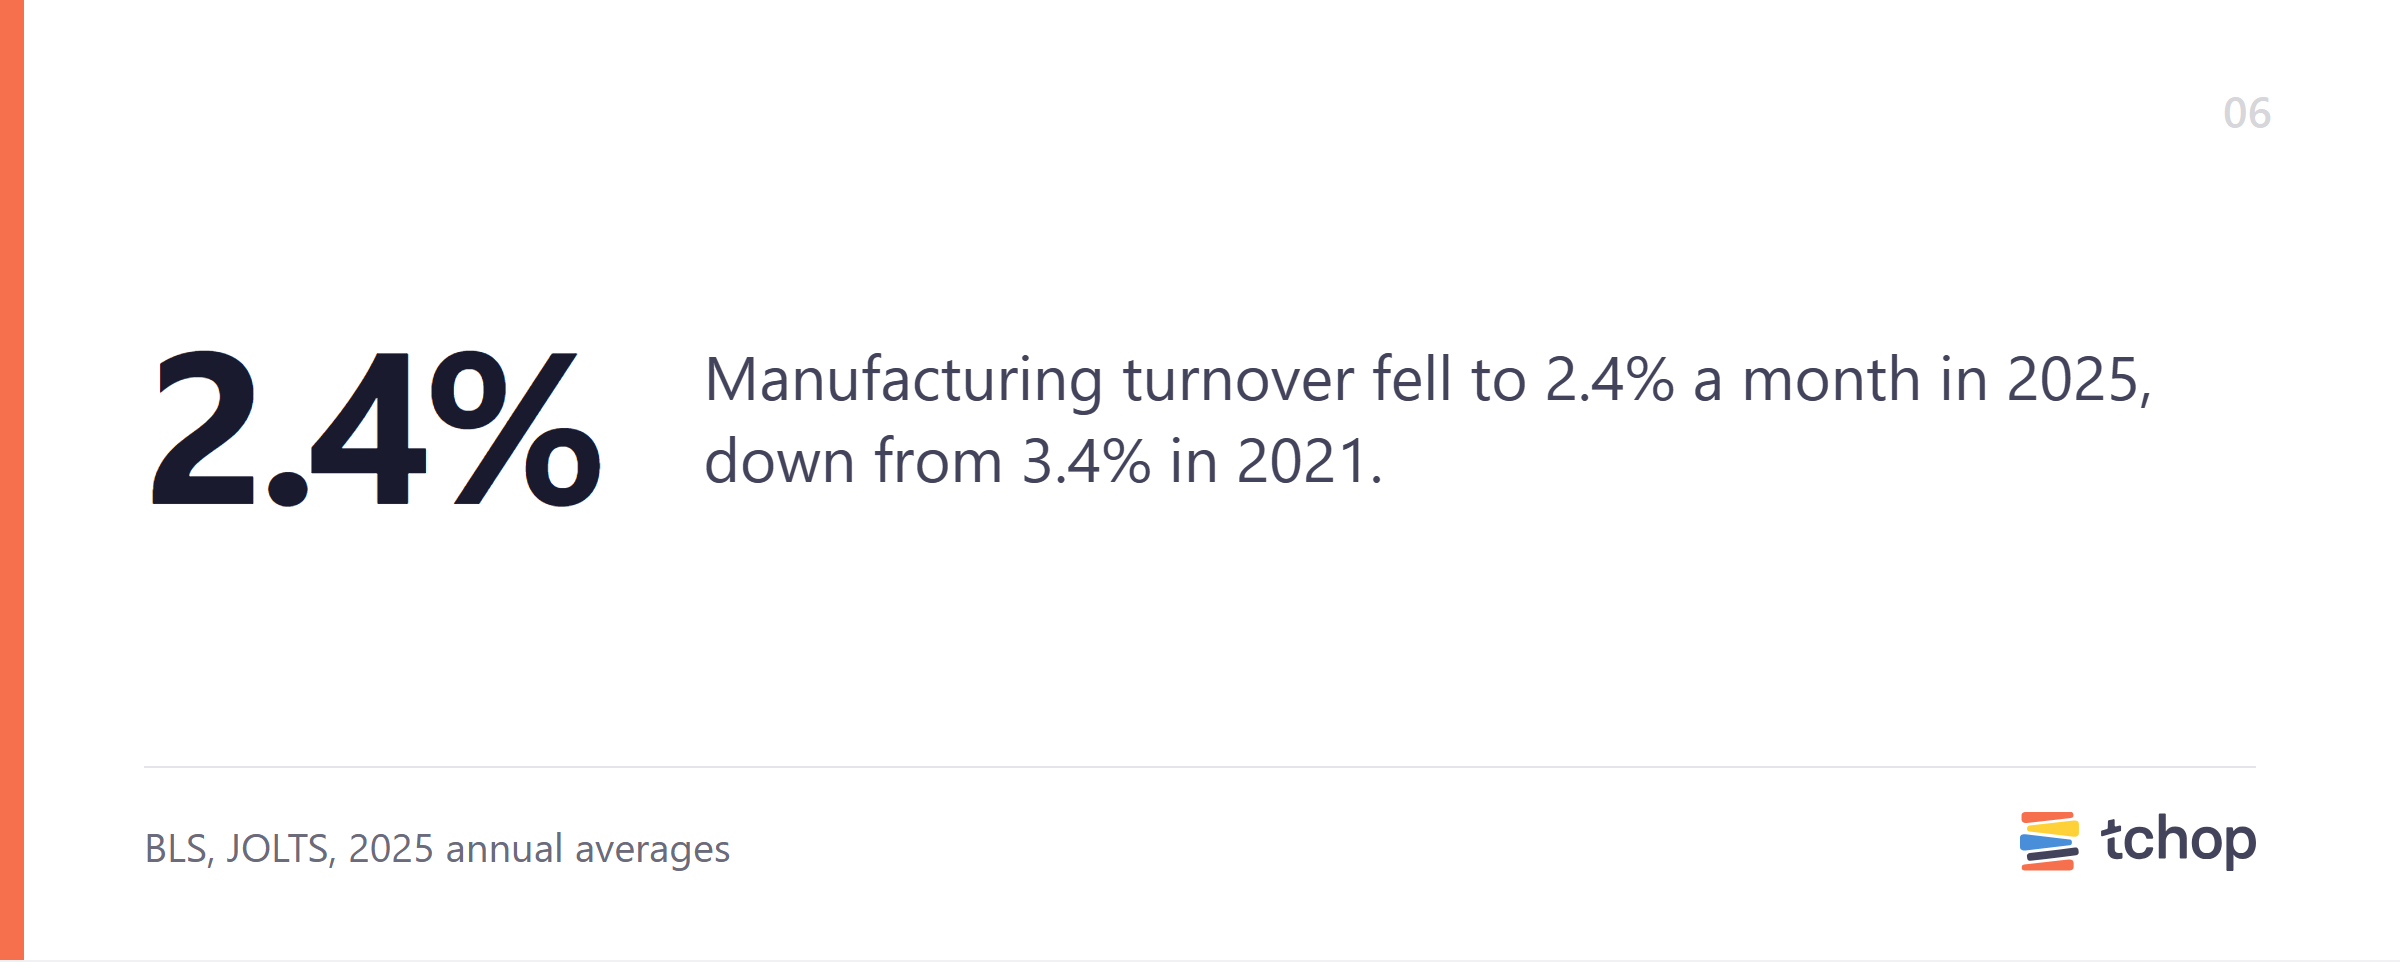
The manufacturing turnover rate was 2.4% a month in 2025, about 29% a year. It has fallen every year since 2021, from 3.4% to 2.7% in 2024 and 2.4% in 2025, and is now among the lower rates in the private sector. Quits were 1.4% and layoffs and discharges 0.9%.
Construction: 4.0% a month
Construction turnover was 4.0% a month in 2025, about 48% a year, unchanged from 2024. It is one of only two industries, with arts, entertainment, and recreation, where layoffs and discharges (2.1%) are higher than quits (1.8%). That fits the way the BLS counts layoffs, which includes the end of seasonal and short-term jobs.
How turnover has changed since 2021
Data
How turnover has changed since 2021
| Year | Total separations, monthly | Quits, monthly | Layoffs and discharges, monthly |
|---|---|---|---|
| 2021 | 3.9% | 2.7% | 1.0% |
| 2022 | 3.9% | 2.8% | 1.0% |
| 2023 | 3.6% | 2.4% | 1.1% |
| 2024 | 3.3% | 2.1% | 1.1% |
| 2025 | 3.3% | 2.0% | 1.1% |
Source: BLS JOLTS, tables 20, 22, and 24, all US industries, annual averages (monthly rates), sample of about 21,000 establishments.
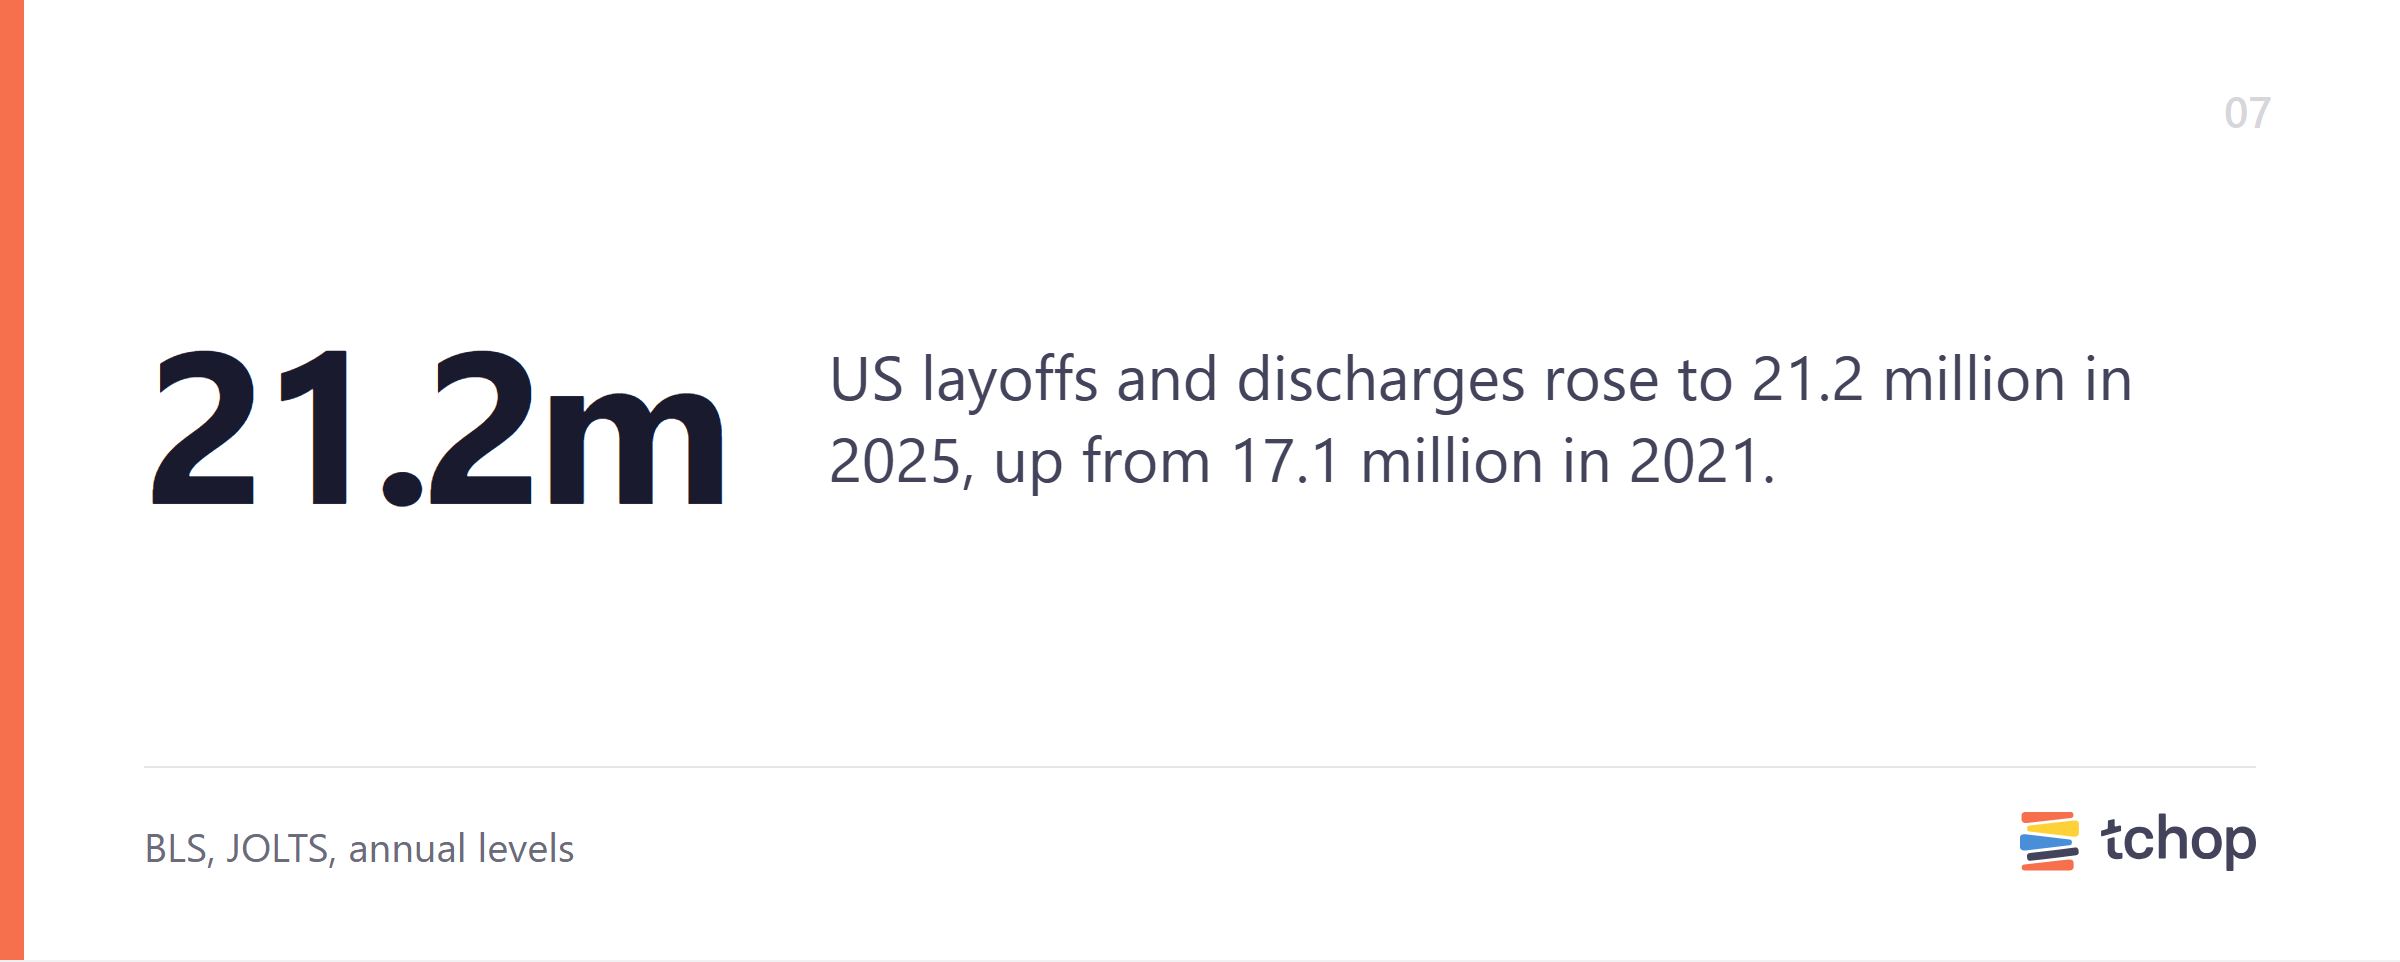
The overall rate has come down from its 2021 and 2022 level and held steady at 3.3% for two years. Underneath, the mix has shifted: quits have fallen, while layoffs and discharges have risen. In total numbers, quits fell from 47.6 million in 2021 to 38.0 million in 2025, while layoffs and discharges rose from 17.1 million to 21.2 million.
Turnover also varies by region. In 2025, it was lowest in the Northeast (3.0% a month) and highest in the Midwest (3.5%), with the South at 3.4% and the West at 3.3%.
What is a good turnover rate?
There is no single “good” turnover rate that fits every company. The most useful benchmark is the average turnover rate by industry for your own sector. A hotel with 4% monthly turnover is below the 5.5% average for accommodation and food services. A bank with the same rate would be almost twice the 2.1% average for finance and insurance.
Three questions help you read your own number:
Is it mostly quits or mostly layoffs? Quits show how many people chose to leave. Layoffs reflect your own decisions as an employer, including the end of seasonal work.
Who is leaving? Losing experienced people in key roles costs more than losing people in roles you were planning to change anyway.
Which way is it moving? A change compared with last year often tells you more than the level itself.
A very low rate isn’t automatically a good sign either. Some movement brings in new people and new skills. What matters most is whether the people you want to keep are staying.
How internal communication affects turnover
Communication on its own won’t solve turnover. Pay, working conditions, and the job market all play a part. But there is strong evidence that engagement and retention go together.
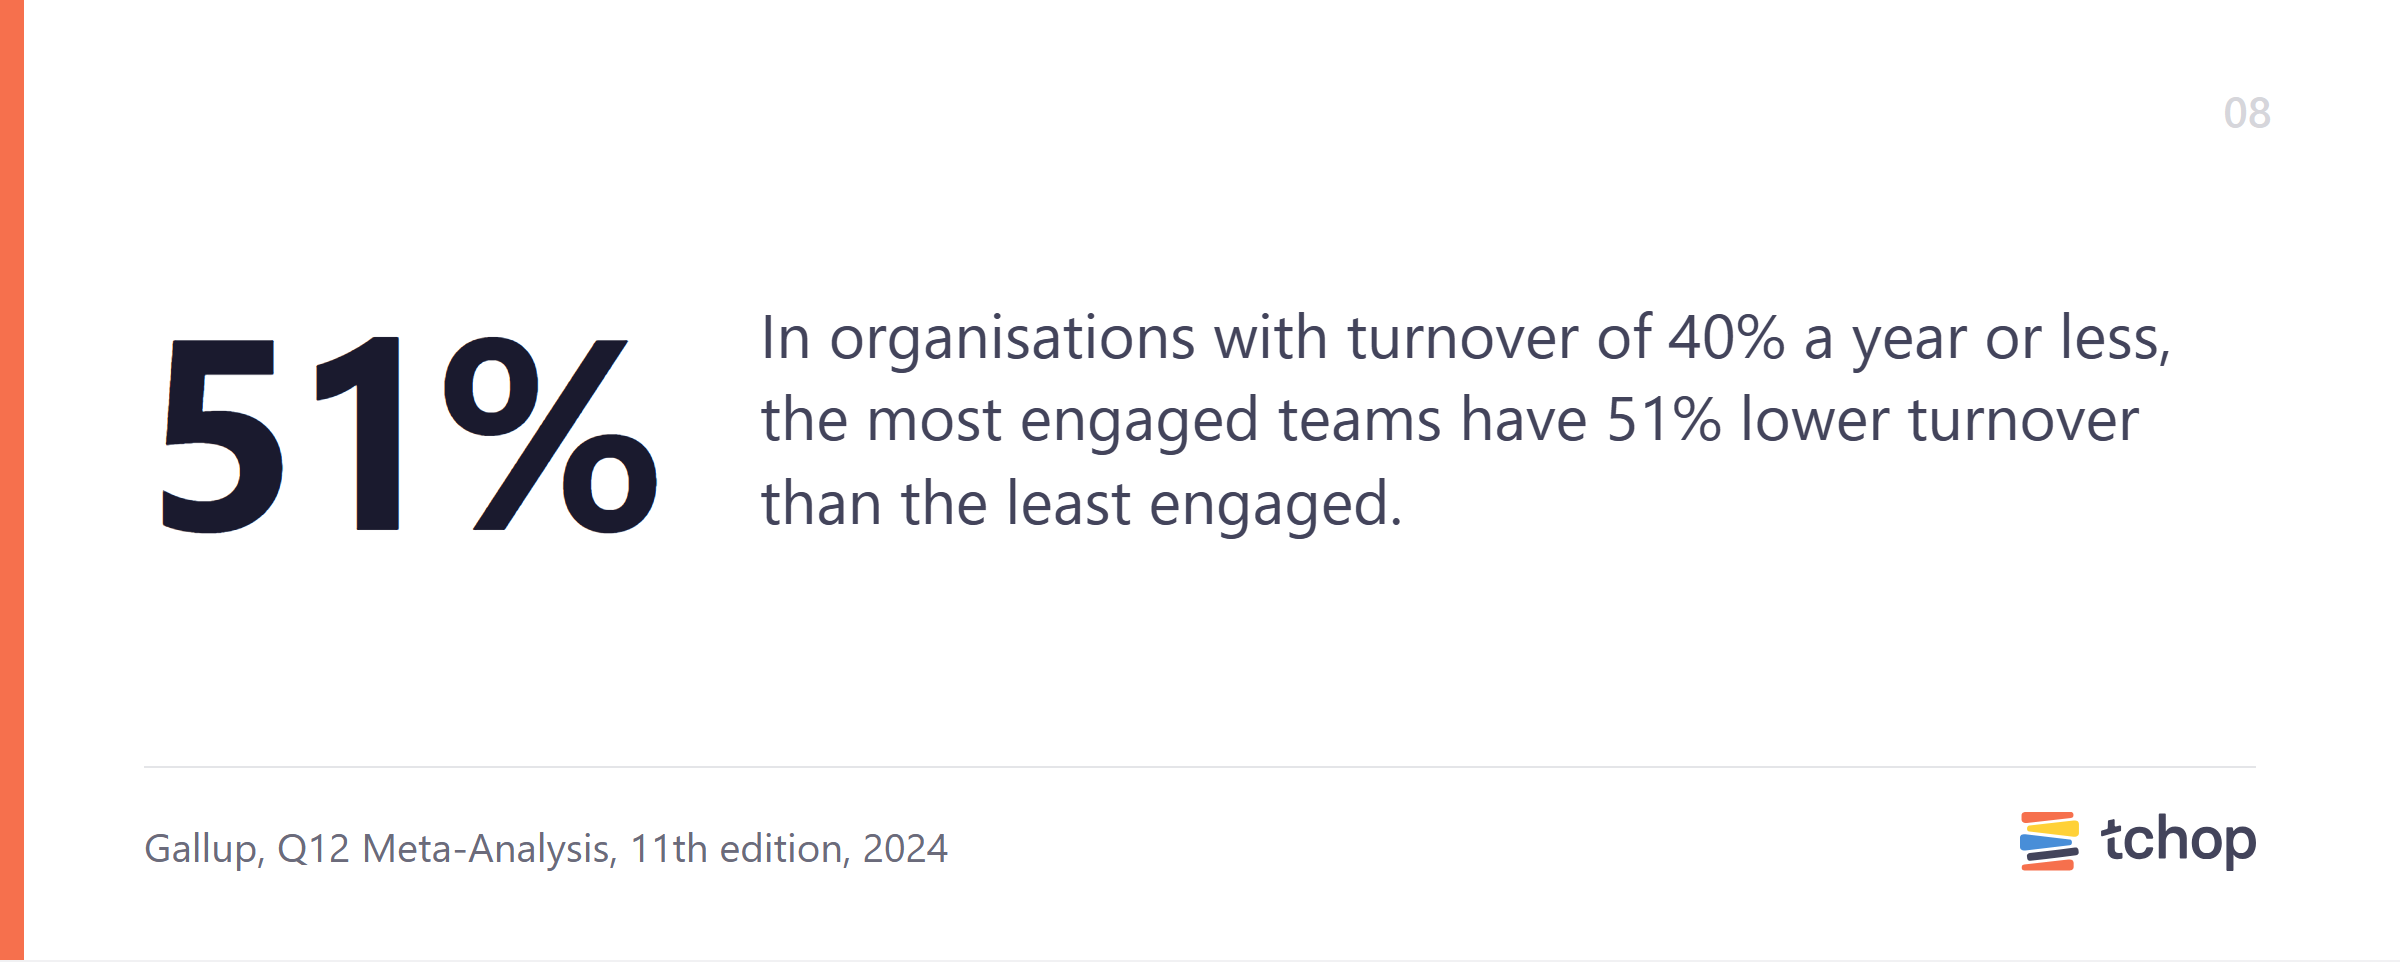
Gallup’s latest meta-analysis, covering 183,806 business units with 3.35 million employees in 90 countries, compared teams in the top quarter for engagement with those in the bottom quarter. At the median, the most engaged teams had 21% lower turnover in high-turnover organisations (more than 40% annualised turnover) and 51% lower turnover in organisations with turnover of 40% a year or less (Gallup Q12 Meta-Analysis, 11th edition, May 2024).
Managers play a central role. In the same report, Gallup explains that its exit interviews in the 1980s, which helped shape its engagement survey, found that a common reason for leaving was the quality of the manager. Today, managers are under pressure themselves: global manager engagement fell from 27% in 2024 to 22% in 2025, according to Gallup’s State of the Global Workplace 2026, based on 141,444 employed respondents in more than 140 countries.
For internal communication, that leads to three practical priorities:
Make the first weeks count. In high-turnover industries, onboarding is continuous. Clear, consistent information from day one helps new starters settle in.
Equip managers and shift leads. They’re often the ones who explain decisions to their teams. Giving them updates that are ready to share, and an easy way to stay in touch every day, supports the relationship that matters most for retention.
Reach the people who are hardest to reach. Frontline employees are often the least connected to company news, and several frontline industries are among those with the highest turnover. Channels built only for desk-based staff leave them out.
For more on the engagement side, see our post on employee engagement statistics and our take on why authenticity in internal comms is the real retention strategy. Our glossary also explains employee retention communication and retention metrics in communication.
FAQ
What is the average employee turnover rate?
In 2025, the average employee turnover rate in the US was 3.3% a month, according to the BLS, or about 40% over the year. If you’re asking what the average turnover rate for a company is, the private-sector figure is the closest match: 3.6% a month, or about 43% a year. Your own industry’s average is a more precise benchmark.
Which industry has the highest turnover?
Arts, entertainment, and recreation had the highest turnover of any individual industry in 2025, at 6.1% a month, followed by accommodation and food services at 5.5% and professional and business services at 4.6%. Accommodation and food services also had the highest quits rate, at 4.2% a month.
What is a good turnover rate?
There is no universal benchmark. Compare your rate with the average for your industry, check whether it is driven by quits or layoffs, and watch how it changes from year to year.
How do you calculate turnover rate?
Divide the number of employees who left during a period by the average number of employees in that period, then multiply by 100. To compare a monthly rate with an annual one, multiply the monthly rate by 12.
How often does the BLS publish turnover data?
The BLS publishes JOLTS data every month, about five weeks after the month ends. Annual averages for the previous year come out with the January data, which is released in March. The 2025 figures were published on 13 March 2026.
Keep every employee informed, wherever they work
If you want to reach every employee, including people on the frontline without a desk or company email, see how the tchop employee engagement platform works. Book a 20-minute demo.